pacman::p_load(GWmodel, sf, spdep, tmap, tidyverse, knitr)In-class Exercise 5
hunan <- st_read(dsn = "data/geospatial", layer = "Hunan")
hunan2012 <- read_csv("data/aspatial/Hunan_2012.csv")
hunan <- left_join(hunan, hunan2012) %>% select(1:3, 7, 15, 16, 31, 32)write_rds(hunan, "rds/hunan.rds")Use echo: false to hide the import.
GWModel is too old to work with sf, so we have to use sp.
hunan_sp <- hunan %>% as_Spatial()The cool thing about GWModel is that it has features to help us determine the bandwidth. It has two method types, cross validation ("CV") and AIC.
To use fixed distance, just change adaptive to FALSE. Note that the output is kilometres instead of metres.
Note that if using fixed distance, changing types can yield a large difference. Just experiment with the output.
bw_AIC <- bw.gwr(GDPPC ~ 1, data = hunan_sp, approach = "AIC", adaptive = TRUE, kernel = "bisquare", longlat = T)Adaptive bandwidth (number of nearest neighbours): 62 AICc value: 1923.156
Adaptive bandwidth (number of nearest neighbours): 46 AICc value: 1920.469
Adaptive bandwidth (number of nearest neighbours): 36 AICc value: 1917.324
Adaptive bandwidth (number of nearest neighbours): 29 AICc value: 1916.661
Adaptive bandwidth (number of nearest neighbours): 26 AICc value: 1914.897
Adaptive bandwidth (number of nearest neighbours): 22 AICc value: 1914.045
Adaptive bandwidth (number of nearest neighbours): 22 AICc value: 1914.045 bw_AIC[1] 22gwstat <- gwss(data = hunan_sp, vars = "GDPPC", bw = bw_AIC, kernel = "bisquare", adaptive = TRUE, longlat = T)Note that the parameters for this and bandwidth calculation must be the same. The bandwidth of 22 neighbours gets interpreted as 22 kilometres if you specify it incorrectly.
This includes self.
If you go look at gwstat[["SDF"]]@data, it does not have a column that you can easily join with. So first we convert that into a data-frame.
gwstat_df <- as.data.frame(gwstat$SDF)
hunan_gstat <- cbind(hunan, gwstat_df)
cbind simply uses the row number to join. This means that the sequence must not change and hence you cannot sort your data.
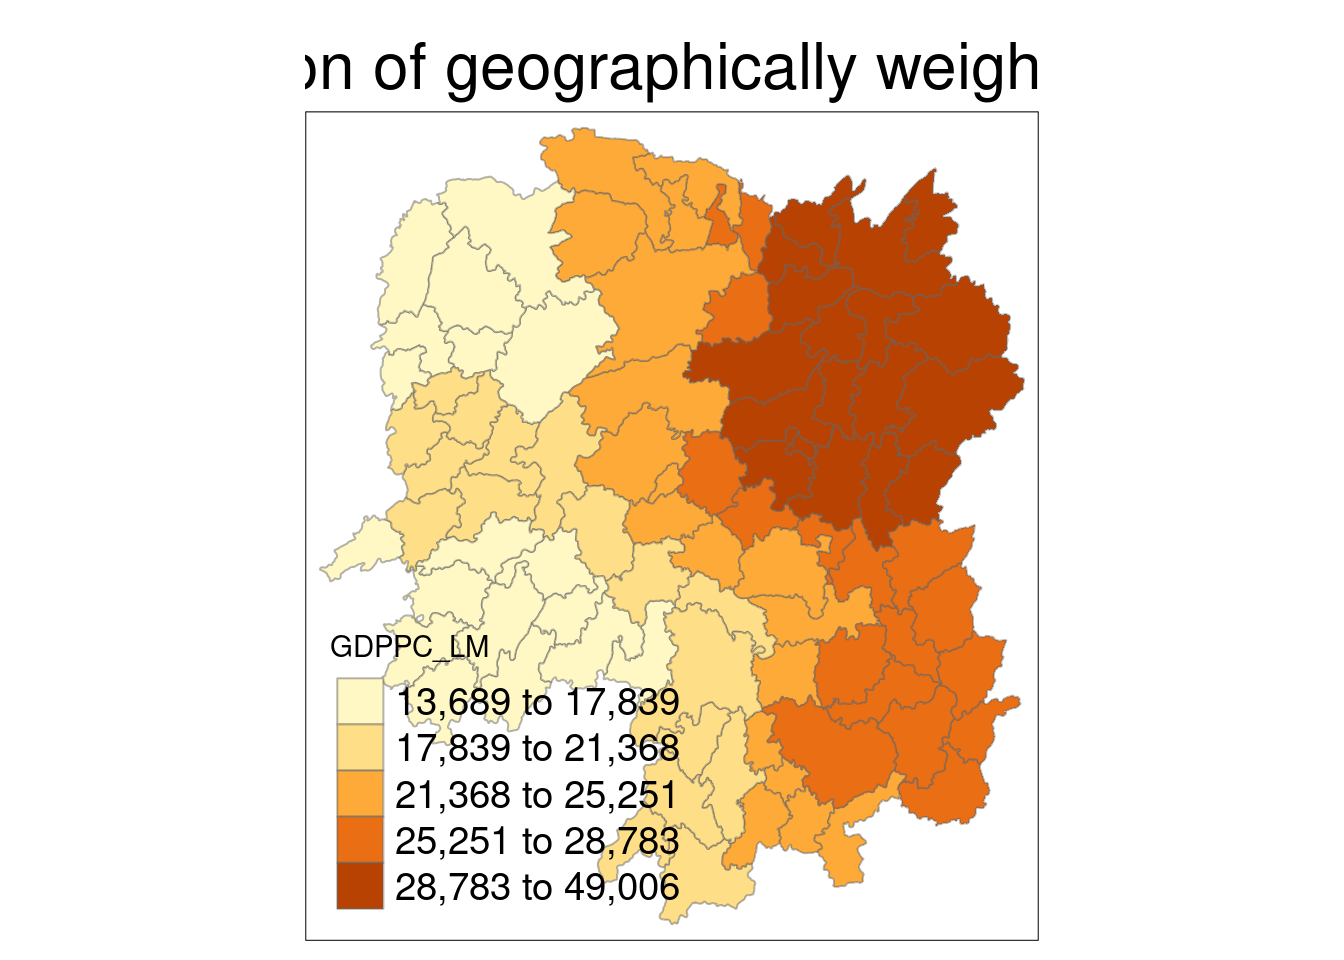
tm_shape(hunan_gstat) +
  tm_fill("GDPPC_LM", n = 5, style = "quantile") +
  tm_borders(alpha = 0.5) +
  tm_layout(main.title = "Distribution of geographically weighted mean", main.title.position = "center", main.title.size = 2.0, legend.text.size = 1.2, legend.height = 1.5, legend.width = 1.5, frame = TRUE)